 All Articles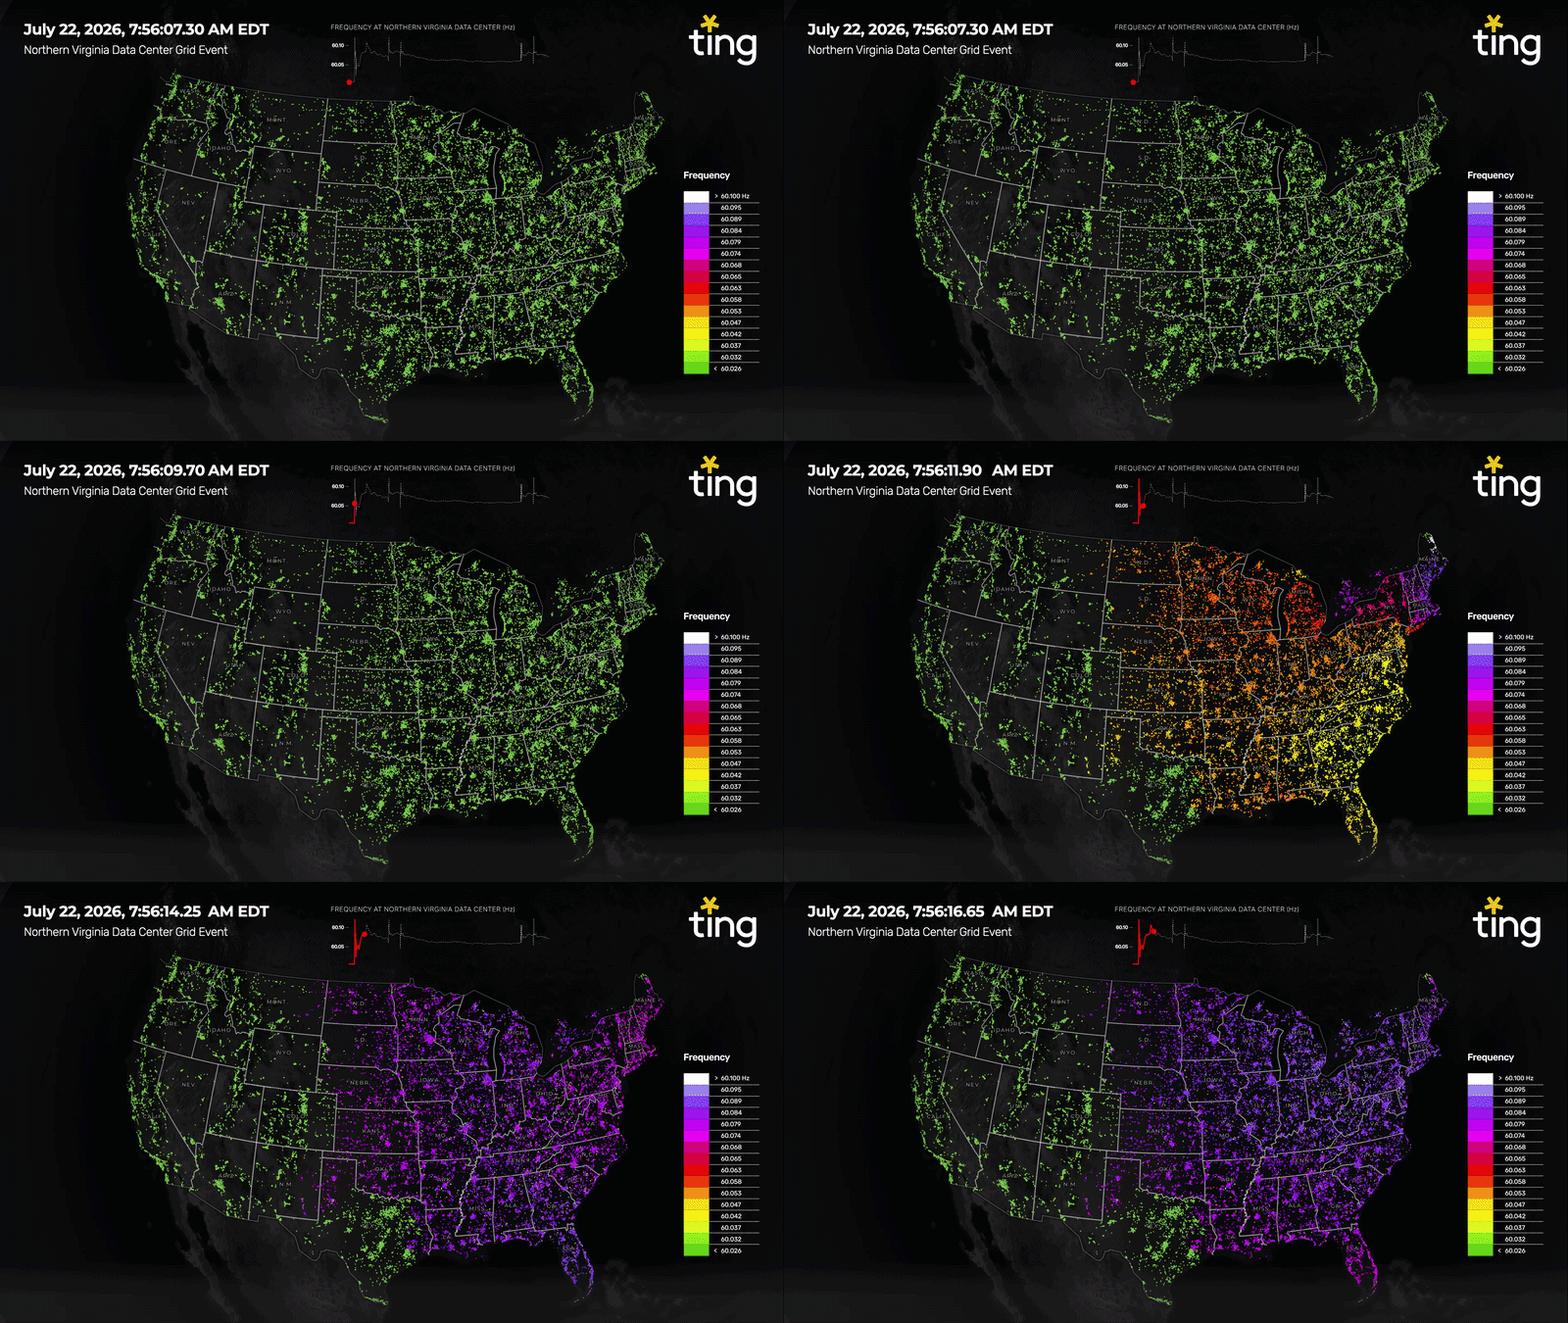
Executive Summary:
On July 22 at 7:56:09 a.m. EDT, a Dominion Energy transmission line fault in Northern Virginia caused a cluster of data centers to instantaneously switch to backup power, removing roughly 3 gigawatts of demand from the grid. Ting Labs network of 1.4 million sensors captured the resulting frequency and voltage disturbance rippling across the entire Eastern Interconnection, affecting an estimated 100 million homes and 238 million people. Crucially, the grid did not fail: PJM, Dominion, and regional utilities absorbed the imbalance, with the sharpest effects lasting about two minutes and full frequency recovery within roughly ten. The event is notable less for what went wrong than for its scale and speed, and it validates the need for real-time grid intelligence, close coordination between grid stakeholders and regulatory concerns about data center ride-through requirements to boost grid resilience.
Key points:
- Cause: a transmission fault triggered near-simultaneous transfer of multiple data centers to backup power, an almost instantaneous 3 GW swing in demand.
Impact: frequency and voltage disturbances propagated across the Eastern Interconnection within seconds, though the largest voltage swings stayed concentrated in Virginia and Maryland. - Outcome: no cascading blackout; the system self-corrected within minutes, demonstrating existing grid resilience.
- Managing risk: NERC and FERC have flagged data-center load behavior as a bulk-power-system reliability concern, and this event sits at the low end of a previously hypothetical 3-5 GW scenario.
- Underlying need: Utilities and grid operators have varying levels of monitoring systems, including supervisory control and data acquisition systems, phasor measurement units, substation instrumentation and other operational technologies. Those systems are indispensable. But they do not necessarily provide continuous, highly granular measurements from the customer edge across every community affected by an event.
- Path forward: better coordination between utilities and data centers on load modeling and real-time visibility, an area where Ting’ Labs granular sensor data can add insight beyond traditional grid monitoring.
What’s in this article:
- The Event
- What the frequency animation shows
- The grid worked
- Why the speed of the load loss matters
- The voltage data tells the first part of the story
- Why data centers transfer to backup power
- Data centers and utilities share the same objective
- The regulatory focus is growing
- Real-world measurements can improve grid models
- Broader resilience implications
- The most important outcome
- A new view of the grid
- Talk to Ting Labs
The Event
At 7:56:09 a.m. EDT on July 22, Ting Labs detected the beginning of a major electric-grid event in Northern Virginia. Our Ting sensor network of 1.4 million time synchronized power quality sensors monitored anomalies that spanned the entire Eastern Interconnection, impacting ~100M homes and ~238M people.
From public reports, a Dominion Energy transmission line in Northern Virginia’s went out of service. In response to the disturbance, a number of data centers transferred rapidly from grid power to backup systems.
Approximately 3 gigawatts of electricity demand disappeared from the grid instantaneously.
That abrupt loss of load created a significant imbalance between generation and demand. In simple terms, power plants were still producing electricity for loads that were no longer drawing it.
The effects, though, were not confined to Northern Virginia.
Ting’s distributed sensor network captured the resulting frequency and voltage disturbance propagating across the entire Eastern Interconnection within seconds.
The animation accompanying this article is not a model or simulation. It is a real-time, highly granular view of how the electric grid responded to an extraordinary event.
What the frequency animation shows
The animation begins immediately before the event, with measured frequency close to its normal operating level (60 Hz, colored in green).
Once the data-center load transfers away from the grid, the system frequency rises rapidly, and you can see colors changing from green to purple to white, each color representing variance from the normal level. That response shows the sudden imbalance created when approximately 3 GW of demand disappears while generation initially remains unchanged.
The disturbance quickly becomes visible across much of the Eastern Interconnection.
The geographic scale is important. The initiating transmission event occurred in Northern Virginia, but the frequency response was shared across the interconnected system. Ting sensors located thousands of miles away detected the grid responding to the same underlying imbalance.
The animation then shows the grid’s response evolving over time. Frequency does not simply rise and immediately return to normal. The system overshoots, adjusts and gradually damps the disturbance as automated controls, generating resources and grid operators work to restore balance.
Ting network data shows that the strongest impacts of the disturbance lasted approximately two minutes, while the broader frequency recovery took close to ten minutes.
That is a substantial period in electric-grid operations, where supply and demand must remain continuously balanced, and typical imbalances last for very short periods.
The grid worked
It is important to be clear about what did—and did not—happen.
This event did not produce a cascading blackout or a broad grid failure.
The Eastern Interconnection absorbed the disturbance, damped the resulting frequency and voltage deviations and returned to normal operating conditions.
Dominion Energy, PJM and utilities throughout the interconnection deserve credit for successfully managing an extremely large and rapid change in load.
Dominion has said that its system operators stabilized the situation and returned the system to normal operating conditions within minutes. Public reporting likewise indicates that the initiating event was a transmission-line fault and that some affected data centers transferred to backup power.
This successful recovery is good news.
But the size, speed and geographic reach of the event, and the details of the response of the grid also make it an important opportunity to understand how the grid is changing.
Why the speed of the load loss matters
A 3 GW change is significant under any circumstances.
The fact that it occurred nearly instantaneously makes it much more consequential.
Grid operators routinely manage changes in electricity demand. Those changes normally occur gradually enough to be forecasted and balanced through scheduled generation, reserves, automatic controls and operator action.
A sudden multi-gigawatt loss of load is different.
When a large amount of demand disappears at once, grid frequency rises. Generators and grid controls must quickly reduce output or otherwise absorb the imbalance.
The greater and faster the change, the more difficult it can be to manage.
Previous Northern Virginia incidents had already raised concerns about groups of data centers responding similarly to transmission disturbances. In discussing earlier events involving less than 2 GW of lost load, a senior PJM operations executive publicly asked what might happen if the loss were 3 GW or 5 GW.
The July 22 event appears to have reached the lower end of that previously hypothetical range.
Deeper Dive:
The voltage data tells the first part of the story
The animations show the response to the sudden imbalance between generation and load. Frequency and voltage measure different aspects of grid behavior.
Frequency primarily reflects the real-time balance between total generation and demand across an interconnected system. Voltage is more strongly influenced by local and regional power flows, reactive-power conditions, transmission and distribution topology and equipment response.
Ting sensor network’s voltage data provides another view of the event.
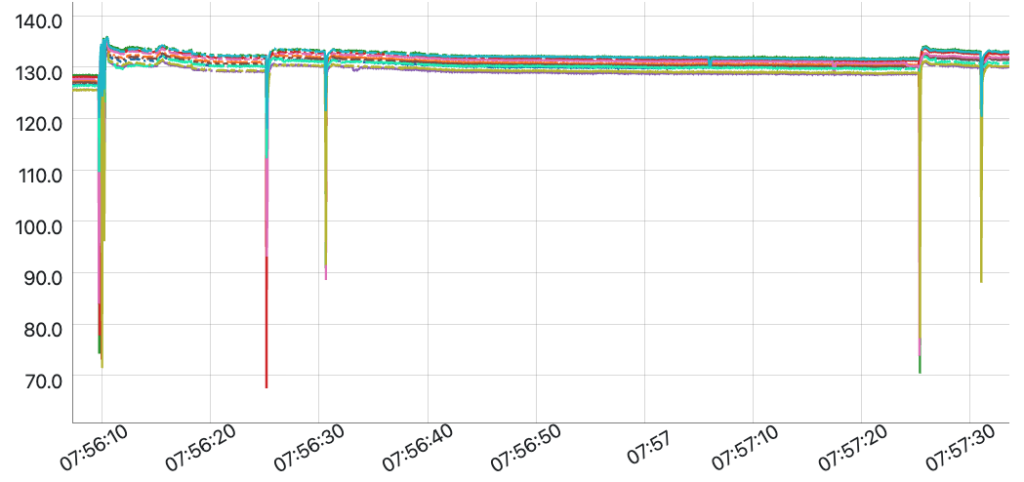
Voltage Date from Northern Virginia Ting Sensors
At the outset, Ting sensors detected deep voltage sags across a broad portion of Northern Virginia and Maryland. These measurements are consistent with the effects expected from the initiating transmission fault and then, likely, re-close events initiated by the utility.
The voltage behavior then changed after the data-center load is no longer present. Ting sensors observed broader voltage increases consistent with the sudden removal of a very large amount of demand and the subsequent response of the power system. Large voltage sags and swells were limited mostly to northern Virginia and neighboring Maryland. But small voltage swells were measured to the far western portions of the eastern interconnect.
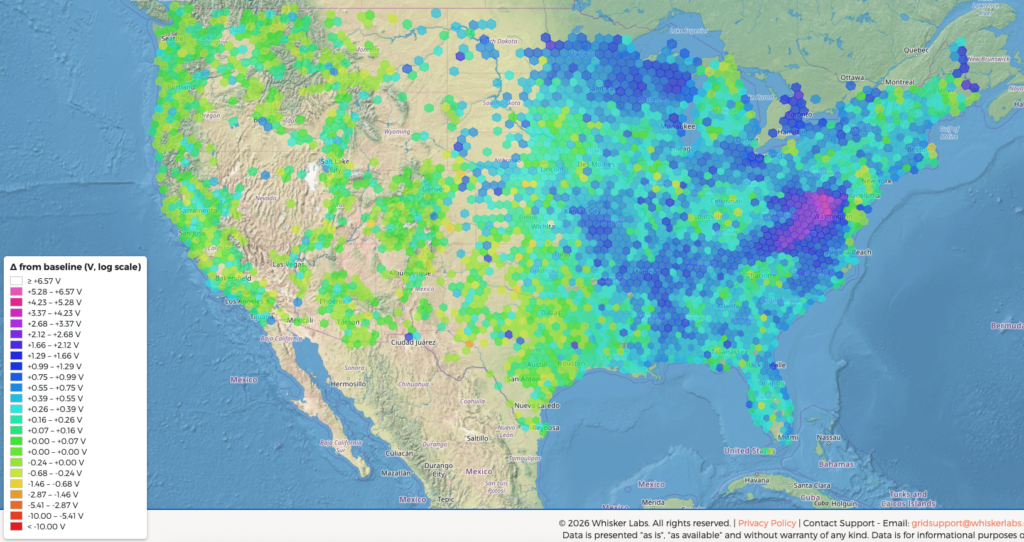
Animation of Voltage Disturbance Propagation (values indicated are change from average baseline voltage prior to event)
Together, frequency and voltage provide a far more complete account of the event:
- The frequency measurements show the resulting system-wide generation-load imbalance and the Eastern Interconnection’s response.
- The voltage measurements help reveal the initiating disturbance and its local and regional effects.
This combination is especially valuable because grid events are rarely explained fully by a single measurement.
Why data centers transfer to backup power
Data centers depend on extremely high levels of power quality and continuity.
Even brief electrical disturbances can threaten sensitive computing equipment, cooling systems and critical digital services. Data centers therefore employ uninterruptible power supplies, batteries, backup generators and sophisticated protection systems.
When those systems detect voltage or power-quality conditions outside their acceptable range, they may transfer the facility’s critical load away from the grid.
From the individual data center’s perspective, that response is designed to protect equipment and maintain service.
The grid-level challenge arises when many large facilities detect the same disturbance and respond at approximately the same time.
NERC has identified this behavior as a potential bulk-power-system reliability risk. Its analysis notes that data-center UPS systems can instantaneously assume facility load during a voltage disturbance and that differences in equipment design and control settings can affect how facilities respond.
The issue is therefore not that data centers have backup power.
Backup systems are essential.
The issue is whether utilities and grid operators have sufficient information about when, why and how gigawatts of data-center load may transfer—and whether protection and ride-through settings can be coordinated to protect both the facilities and the wider grid.
Data centers and utilities share the same objective
This event should not be framed as utilities versus data centers.
Both depend on a reliable and resilient electric system.
Utilities need to understand how large data-center loads will behave during transmission faults, voltage excursions and other disturbances.
Data centers need to understand the conditions their facilities are experiencing, whether their protection systems are responding as intended, and how their operations interact with the surrounding grid.
Better coordination can improve outcomes for both.
That coordination may include:
- more accurate models of data-center electrical behavior;
- validated voltage and frequency ride-through settings;
- improved communication between grid operators, utilities and large-load customers;
- better visibility into transfers to and from backup systems;
- commissioning and testing procedures that reflect actual facility behavior; and
- post-event data detailed enough to distinguish assumptions from measured reality.
NERC’s large-load work has emphasized the need for better interconnection studies, modeling, commissioning and operational coordination for facilities whose size or behavior can affect bulk-system reliability.
The regulatory focus is growing
Federal regulators and reliability organizations have already recognized that large loads require new approaches.
NERC has established a Large Loads Task Force and published work examining the characteristics and reliability risks of data centers and other emerging large loads. Its work specifically identifies computational loads as presenting distinct bulk-power-system challenges.
FERC is also examining reforms for large loads connecting to the interstate transmission system. Its current proceeding generally considers large loads to be facilities with demand greater than 20 MW—a fraction of the combined load involved in the July 22 event.
The regulatory questions extend beyond how quickly new data centers can connect.
They include how large loads are studied, modeled and operated after interconnection; how their protection systems interact with the bulk power system; what information must be shared with system operators; and how costs and reliability obligations should be allocated.
The July 22 event provides a real-world demonstration of why those questions are urgent.
Visibility remains a vital necessity
Utilities and grid operators have varying levels of monitoring systems, including supervisory control and data acquisition systems, phasor measurement units, substation instrumentation and other operational technologies.
Those systems are indispensable.
But they do not necessarily provide continuous, highly granular measurements from the customer edge across every community affected by an event.
That is where the Ting Sensor network provides a different and complementary perspective.
Ting observes power conditions from a large number of geographically distributed locations. This makes it possible to see how a disturbance is experienced across neighborhoods, utility territories and large portions of the interconnected grid.
For an event like July 22, that visibility can help answer critical questions:
- Where did voltage conditions change first?
- How deep and geographically extensive were the voltage sags?
- How rapidly did the frequency disturbance propagate?
- Did different regions respond in the same way?
- How long did recovery take at different locations?
- Where did measured behavior differ from existing models?
- Did customers experience conditions that conventional monitoring did not fully capture?
These are not merely academic questions.
They can inform operational reviews, grid modeling, transmission and distribution planning, protection studies, data-center design, resilience investments and future reliability standards.
Real-world measurements can improve grid models
Grid planning and operations depend heavily on models.
Those models attempt to represent generators, transmission facilities, distribution systems, customer loads, protection systems and automated controls.
But a model is only as useful as its underlying assumptions, data and validation.
Large modern data centers are electrically complex facilities. Their behavior can be influenced by UPS topology, power electronics, cooling systems, generator controls, transfer logic, protection settings and operating mode.
If a model assumes that a facility will remain connected during a disturbance but the facility actually transfers to backup power, the model may materially understate the size of a potential load-loss event.
Conversely, overly conservative assumptions could lead to unnecessary costs or constraints.
Highly granular measured data allows utilities and data centers to compare predicted behavior with actual behavior.
It can reveal where a model performed well, where it did not and which assumptions require refinement.
That process—measurement, validation and improvement—is fundamental to building a more resilient grid.
Broader resilience implications
There is no public indication that the July 22 event resulted from malicious activity.
It should not be characterized as a cyberattack or deliberate disruption.
However, the event is relevant to broader critical-infrastructure resilience because it demonstrates how an initiating disturbance in one location can trigger a rapid, coordinated response from a very large concentration of load.
The same observational capabilities that help analyze equipment failures can also support understanding of events caused by severe weather, operational mistakes, physical damage or cyber-physical incidents.
During any major disturbance, decision-makers need to know what is happening, where it is happening, how quickly it is spreading, and whether the system response is matching expectations.
Independent, distributed measurements can provide valuable additional situational awareness—particularly when traditional sources are incomplete, delayed or concentrated primarily on transmission-level assets.
The most important outcome
The most important fact about July 22 is that the grid recovered.
Utilities and grid operators successfully managed a very large and abrupt imbalance without a cascading failure.
That deserves recognition.
The next step is to learn as much as possible from the event.
The combination of utility operational data, data-center system information and Ting sensors’ geographically distributed measurements could provide an unusually complete picture of what happened—from the initiating voltage disturbance in Northern Virginia to the frequency response across the Eastern Interconnection.
That kind of collaboration can help utilities improve models and operating plans.
It can help data centers validate protection systems and better understand their interaction with the grid.
It can help regulators develop requirements grounded in measured behavior.
And it can help ensure that the next large disturbance is managed just as successfully—or better.
A new view of the grid
The July 22 animation is compelling because it makes an otherwise invisible event visible in incredible detail.
It shows that a transmission fault in Northern Virginia and the nearly instantaneous loss of approximately 3 GW of data-center demand did not remain a local issue.
The response rippled across the Eastern Interconnection.
It also shows that the grid is not static. It is a dynamic, tightly interconnected system that continuously responds to changing conditions.
For utilities and data centers, understanding those dynamics is becoming more important as individual facilities grow larger, and regional concentrations of load become more significant.
Ting provides a uniquely comprehensive, real-time and highly granular view of what the grid is actually experiencing.
The grid recovered successfully on July 22.
Now the industry has an opportunity to use the data, improve its understanding and make the system even more resilient.
Talk to Ting Labs: info@tinglabs.com
Interested in learning more? Contact us to dive into the data and explore how we can partner.