Learn more about CPQI
The CQPI is a proprietary measure of the resiliency of a given electric utility provider or grid area over the course of a given period (currently, by month). The CPQI factors in power outages/interruptions, power brownouts, and power surges as seen across area homes.
Our mission of fire prevention and safety has led us here.
Electricity is an essential resource for so many things in our modern lives. Not surprisingly, access to quality, safe and reliable power is critical for all of us and carries a larger impact than most of us realize. A recent Electrical Power Research Institute (EPRI) study sites that poor power quality costs U.S. businesses (just businesses, this does not include the impact on consumers) between $150 billion and $230 billion annually.
Regardless of how power is generated, it can cause numerous problems for homes and businesses alike if it is not safe or reliable. Even though safe and reliable electricity is incredibly important, shockingly, a method/system to measure and monitor it did not exist until now.
The Ting CPQI is based on high-quality, accurate measurements and it is 100% objective and exclusively derived from Ting data. CPQI is the first of its kind, and it holds value for every stakeholder, including electric utilities. We're helping close a longstanding ‘information gap' to help consumers and businesses understand the quality of their utility's power and how power quality can impact safety, sustainability, and quality of life. It is increasingly important as we 'electrify' more systems and devices.
Further, the U.S. is investing billions of dollars to modernize the grid, knowing that our grid is challenged to keep up with modern demands. That work is well underway. The CPQI is an objective, unbiased metric well-suited as an important input to policymakers and decision-making – such as funding and resource prioritization - and to demonstrate over time how grid improvement projects are impacting power quality.
Each Ting sensor is a highly sophisticated, accurate power quality monitor. Ting detects power outages/interruptions, power surges (high voltage), and power brownouts (low voltage) in real time. The CPQI summarizes these community power outages/interruptions, brownouts, and surges in electric utility power, measuring the frequency of those events for a given month as experienced across homes in an electric utility's grid footprint.
The Surge, Brownout, and Power Outage Index values represent the frequency of each event that occurred in the month per Ting-protected home, and the All Events Index value is the sum of these values. Importantly, the CPQI is "normalized" to report only on a per-home basis, so utilities with larger customer bases are not penalized for having more power quality events than smaller ones.
For instance, an All Events Index value of 1.25 means that each home on average experienced slightly more than one event in the month - whether a surge, brownout, or power outage - in the month. In turn, the CPQI is a weighted value that considers all three events and their relative potential impact on the home. On the other end (the good end) of the scale, an All Events Index value of 0.04 means that each home on average experienced nearly zero power quality problems in the month.
Specifications
CPQI = {(Power Outages + Sags Outside CBEMA + (Surges Outside CBEMA * 5))} / (Number of homes in territory)
- The Ting network grows daily. For the CPQI, the number of homes is calculated for the last day of the month and not averaged, so the index values can be slightly under-reported, or conservative, for a given month.
- Reported Power Quality (PQ) events require two independent, simultaneous measurements from different locations within 10km to be included.
- Brownout events do not include sensors with a persistent low voltage for the day. Swell events do not include sensors with persistent high voltage for the day.
Utility service territory geospatial data sourced from Homeland Infrastructure Foundation-Level Data (HIFLD)
Yes, importantly, the CPQI is "normalized" to report only on a per-home basis, so utilities with larger customer bases are not penalized for having more power quality events than smaller ones.
The report is built from data stemming from Ting Sensors - which while on the job helping to protect hundreds of thousands of homes from electrical fires - also accurately detect and measure grid problems in great detail.
Ting measures the electrical voltage in homes 30 million times every second of every day. This allows Ting to analyze the quality of power delivered to the home at super high resolution. Power quality problems can potentially cause damage to appliances, electronics, or other devices in the home.
The power delivered to a home is typically supplied at a normal voltage of 120V plus or minus 10%, or a range from 108V - 132V. However, the voltage can deviate from this 108V – 132V range for very short periods and not be dangerous.
The most common power quality problems are:
- Surges: events when voltage spikes to values greater than 132V for a period of time that could cause damage to devices and appliances. The severity of a surge is determined by both the amplitude of the spike (how high did the voltage go), and the time duration of the spike. Just because voltage exceeds 132V for a very brief period does not mean that the event was technically a surge. We consider all factors when determining whether an event was a true surge (for the technical folks out there, we only measure surges that fall outside the CBEMA/ITIC curve. Additionally, multiple homes must experience the same grid event simultaneously for it to be included in calculating the CPQI.
- Brownouts (sometimes referred to as sags): events when the voltage drops below 108V for a period of time that could cause damage to devices and appliances. The severity of a brownout is determined by both the amplitude of the drop or sag (how low did the voltage go) and the time duration of the drop. Just because the voltage drops below 108V for a very brief period does not mean that the event was technically a brownout. Ting considers all factors when determining whether an event was a true brownout (for the technical folks out there, we only measure brownouts that fall outside the CBEMA/ITIC curve). Additionally, multiple homes within 10km must experience the grid event simultaneously for it to be included in calculating the CPQI.
In many cases, a single power quality event, or problem, will not necessarily cause damage (depending on the severity), however, an accumulation of power quality problems over time can lead to damage or a shortened life of important devices and appliances in the home. In the worst case, severe power quality problems can create fire hazard problems inside homes and be wildfire ignition threats in arid climates.
Power Outages/Interruptions. Ting measures power outages/interruptions as events where power is lost to the home, independent of duration. Planned or not, and whether they last a fraction of a second or a day, these events are inconvenient at best and can present a power surge hazard when power is restored. To illustrate, an old clock radio without battery backup reverts to blinking at 12:00 when Ting measures a power outage/interruption. An important difference, utilities define very short events as “interruptions” and not as outages. Instead, they define an outage as lasting an extended period. We respectfully believe that Ting’s power outage/interruption measurement to be a more accurate reflection of how consumers perceive a power outage event, i.e., all devices in the home lost power and had to reboot/restart, and the home internet connection was lost for a bit due to the outage.
The impact of poor power quality is real. Power quality events impact health, safety, and quality of life. Poor power quality can cause damage to devices, appliances, and electronics in homes, and can shorten the life of these devices. In the worst case, ongoing poor power quality can result in a fire hazard to homes and potentially present wildfire ignition threats in arid climates. However, there are no current, comprehensive studies on the impact of power quality on homes/consumers.
One such study related to power quality events experienced by businesses gives us an idea of their immense economic impact. A recent study published by the Electric Power Research Institute (EPRI), Societal Costs of Power Quality Disturbances (July 2022) states that considering all industrial sectors in the United States, the estimated total annual cost of power quality events to all U.S. business establishments in today’s dollars may be roughly $145 billion to $230 billion.
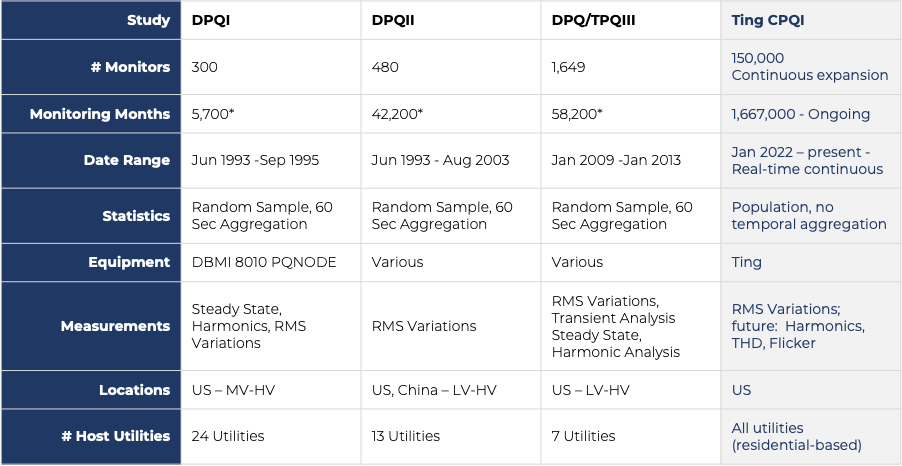
EPRI has also conducted three separate Distribution Power Quality (DPQI, DPQII, and DPQ/TPQIII) studies to study power quality. These studies were very valuable yet relatively speaking were somewhat limited in scope and time. Below are links to these studies and a helpful resource contrasting these past studies with CPQI.
Ting has been extensively tested in the laboratory and the field. Ting’s voltage measurements are accurate to within 1% of the measured value. All data used in the CPQI requires the simultaneous agreement of at least two independent Ting measurements from different locations within 10km. Ting data is successfully being used every day to measure, identify and mitigate grid faults before damage can be done to homes, and in some cases to prevent the ignition of wildfires in arid climates.
It is imperative that we report 'quality' as accurately as possible, which means there must be enough data for us to serve our audience and report with confidence. While we have data for just about every utility in the country, today, our report only includes utilities that serve at least 500,000 homes AND where there are a minimum of 250 Ting-protected homes across a given utility footprint. The Ting network is growing rapidly; the CPQI report will include additional utilities each month.
The ability of the grid to perform in the face of adverse conditions is important – including extreme temperatures, demand, and weather conditions. For that reason, we include all events regardless of cause. Severe storms or events (lightning or fire, for instance) can contribute to or otherwise cause unexpected service interruptions and power quality issues. CPQI provides a true measure of the power quality that any homeowner should expect to receive from their electric utility provider.
If utility service territories overlap, any Ting homes in the overlapped region will count towards the CPQI for both utilities that serve that overlapped region.
That’s a great idea – and we offer this capability today for utilities, commissions, regulators, and safety organizations. It is this real-time grid monitoring that results in the event data used to build the CPQI.
We offer a real-time grid event Twitter feed here.
For utilities, public safety organizations, and related service providers: Power quality and grid fault information can help you better serve your customers - please email us at grid@whiskerlabs.com for more information.
Ting data shows that nearly 1% of all homes have dangerous power being supplied at any given time, mostly caused by loose/open neutral conditions. However, these cases are not included in events that make up the CPQI today.
At the grid edge, these faults either affect a single home, a couple of homes, or in some cases, a small neighborhood area. Most utilities can’t or choose not to – regularly monitor for these conditions. But Ting does.
These hazardous conditions are available in a feed for utilities to prioritize resources and response teams. When remediated, each case is fully documented and confirmed as mitigated, and 100% of the time requires the utility to respond quickly, given that these can be imminent fire threats to impacted homes. This technical analysis from early 2022 highlights these cases.
For utilities, public safety organizations, and related service providers: Power quality and grid fault information can help you better serve your customers - please email us at grid@whiskerlabs.com for more information.
The Ting sensor, software, and network are collectively a “learning” system, and new features are regularly being added. Several additional important power quality measurements will be added to the CPQI soon, including measurements of power harmonics, total harmonic distortion (THD), and flicker. As renewable energy sources, battery systems, and electric vehicles (EV) proliferate across the grid, the importance of these measurements will continue to increase.
For the web resource itself, we plan to provide an interactive map with useful tools and layers to allow users to explore a bit more into the data. The static map image in our current version is the CPQI, in a future version we’ll also provide a means to filter the map view by each event type as well, and also the ability to zoom in on a particular region or utility boundary.